
In the last few years, advanced methods, like predictive analytics, machine learning, and data science have captured business imaginations. Everyone says that’s what you need if you want to make a difference. Executives want to see predictive models that point to the most “at-risk” customers so they can be targeted for retention.
In this article, I will draw from my experience as a Director of Retention Analytics for a leading US cable company and talk about propensity to churn modeling and how it can be applied in practice.
Propensity to Churn Modeling
Let me start with an explanation of what propensity to churn model is.
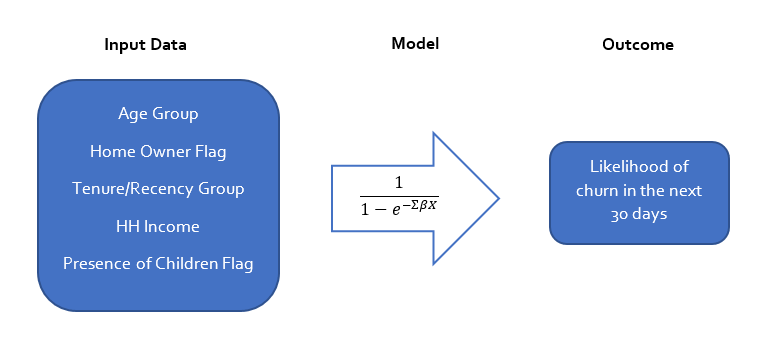
Propensity to churn model estimates the likelihood of a customer to leave in the next period of time. It uses the data about the customer, such as their service level, tenure, payment history, as well as demographics to predict the probability of discontinuing the relationship.
While the model usually returns a value between 0 and 1, we use the word “propensity” to indicate how likely the customer is to churn compared to other customers. In most cases, the customers are ranked based on the propensity to churn and split into groups, from the highest propensity to the lowest.
Steps to Create Propensity to Churn Model
First, the active customers at the beginning of each period are linked to various data about their active product lines, tenure, payment history, as well as demographics. These are our independent or explanatory variables.
Second, the churn data (1 = churn, 0 = remain active) for the following month is added to the customer file. This is the dependent or target variable. I wrote in detail about the data used in churn analytics and how to structure the tables here.
Third, you create a model that uses math to combine input variables and transforms the outcome into 0s and 1s, optimizing the result to be as close as possible to the actual churn outcome.
Modeling Methods
Churn propensity model is a type of a predictive model, as it tries to predict the churn probability for each customer in the next period of time.
The most simple/common modeling method for predictive churn modeling is logistic regression. Logistic regression is very similar to multiple regression, except it transforms the result into a range from 0 to 1, thus matching our dependent variable (or labels, as they call them in machine learning).
Random forests is another good method for propensity modeling. I like that it works very well with variables that have a non-linear relationship to the churn rate, and unlike its many machine learning counterparts, it is virtually impossible to overfit.
While churn forecasting can be challenging at times, with the wealth of information we have on our customers, we should expect to create a pretty good model. For example, it does not take advanced modeling to determine that telecom subscribers who are late on their bill are at high risk of disconnecting.
Avoid Data Leakage When Structuring the Model
It’s important that the input data and the churn result do not overlap in any way. This is called information or data leakage, and it lets the model know about events that should be in the unknown future. It’s very common to have information leaks in models and other types of analyses.
For example, the cable company that I worked for had a three week lag between the customer calling to disconnect to the actual disconnect. Including the information about a call to retention in the month prior to the disconnect was a very strong predictor of churn, but in reality, it was just an artifact of an already created disconnect workorder, which is an example of indirect data leakage.
Your company is not paying you to tell them that customers who create disconnect workorders are the most likely to disconnect.
Predictive Modeling and Churn Reduction
The most common use of propensity modeling in business is finding the best target for churn reduction. Usually, the people with the highest propensity to churn are considered to be good churn reduction targets.
However, this logic has a flaw.
No, let me restate it: this logic has multiple flaws. Let me address the most obvious one.
Effective churn reduction implies that the company’s actions are going to reduce customers’ propensity to churn. But our churn model does not assess how likely we are to reduce this propensity.
While the propensity model informs us about the natural likelihood to churn without any intervention, it tells us nothing about our ability to change customer behavior and stay with us longer.
Turns out, this is not a trivial problem. In fact, many researchers have found that our ability to influence customers may be unrelated or inversely related to their propensity to leave.
In other words, just having a customer segment being marked for high churn risk does not mean that convincing them to stay is the best bang for our buck.
Ultimately, the problem with using the propensity to churn model for retention targeting is that it optimizes for the wrong thing.
How to Use Propensity Modeling for Churn Reduction
Don’t worry, not all is lost.
While propensity to churn model may not point to the most promising segments for churn reduction, it can help us determine whether our churn reduction actions are working.
Knowing our customers’ propensity to churn can be used to create representative control groups for A/B tests of churn reduction programs. Often times, we are not able to select our customer groups randomly, but we can use churn propensity to re-weight the results and make sure we are comparing apples to apples.
Not having an opportunity to select treatment groups randomly is pretty common in churn analytics, and I have written how to handle it in this article.
Experimentation is a powerful tool for identifying initiatives for churn reduction. We can even kill two birds with one stone by measuring both the overall effectiveness of the program and finding the segments it works best for.
In this setup, we randomize those who receive the program and those who don’t, and then analyze the outcome just like we do for clinical trials. If our program works, we should see the difference in retention rate in those who participated in it.
Once we have the results of the test, we can also segment it by different variables, often the ones we identified as drivers of churn rates. This way, we can find specific segments for whom the program works best.
But what if you want to create a model?
The model that does look into who are the people we can convince to stay is called an “uplift model”, and it’s a prescriptive model. This type of model is often developed in conjunction with an in-market test described above, where we look at different factors that help us find customers that are persuadable.
The bottom line, to see what kind of difference retention treatment makes we also must vary the application of the retention treatment, usually, by holding out control groups.
Building an uplift model can be quite challenging, and my general experience suggests that simply running an experiment and segmenting the results is a simpler, more effective way to go.If you would like to learn more about identifying segments for churn reduction and why the high churn customers show low potential as targets, hop over to read the next article in my churn series: Achieving Long Term Growth Through Churn Reduction.