
We all know that saving a customer is cheaper than acquiring a new customer. Thus, churn reduction is central to many companies’ efforts to grow business.
In this article I will talk about the challenges of churn reduction based on my 10 years of experience in retention analytics with a leading telecommunications company.
Every effort needs a focus, so when it comes to attrition, whom do we target for churn reduction? Common sense says “fish where the fish are”. Target the segment with the highest churn rate.
Let’s take a look at a typical monthly disconnect report:
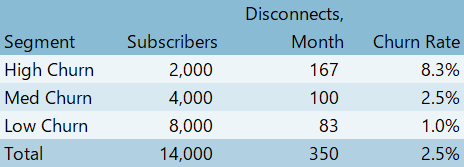
The high churn segment is the natural target for churn reduction. It has the largest absolute disconnects. It has the largest percentage of disconnectors. It’s the smallest segment, and thus cheapest to target proactively.
Let’s see what kind of result we can achieve in one a year if we reduce every segment’s churn by 10%:
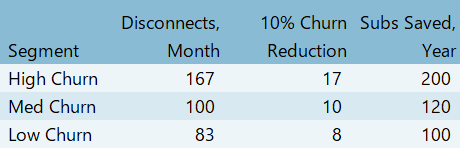
Our strategy seems to be working as intended. High churn segment has the highest number of saved subscribers in the first year.
However, high churn subscribers have a low expected time to disconnect, while low churn subscribers stay around for much longer. Can this impact how the subscriber base grows over the long term?
Looking at the long term impact of churn reduction, it becomes clear that reducing disconnects in the low churn group is the winning strategy if our results horizon is longer than four years.
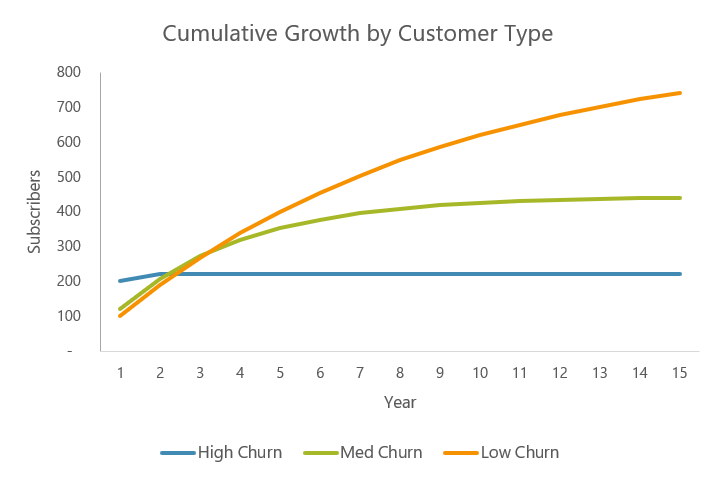
Assumptions: connects remain stable, and disconnect rate is reduced to 90% of the original rate. Absolute number of disconnects grows with the growth of the customer base.
The conclusion we can draw from this simple analysis is that targeting highest churn segment is only effective in the short term. To drive long term growth, companies need to pay attention to attrition among customer groups least likely to disconnect.
In practical terms, low churn customer groups can be well approximated by tenure cutoffs, with high tenure groups overwhelmingly populated by low churn customers. It’s a large group, and proactively determining your targets is not an easy task.
Using Analytics for Segmentation and Targeting
Reducing attrition of low churn customers may be a good strategy, but when we look proactively targeting customers for churn reduction, which segments are most responsive and thus more effective to target?
When targeting low churn groups for further reduction, how can we do it effectively and efficiently?
Predictive analytics
It would be nice to push a button, and have our list of targets ready. But that’s not how predictive analytics usually works. Low churn groups tend to be large, and identifying likely disconnectors among them is challenging because of two factors.
First, the low overall “positive” rate messes up the models. How would you like the model that is 99% right? That would be excellent, would not it? Not if it predicts zero disconnects, which can be the case when 99% of your group stays put.
Second, there is an inherent analytical conflict of identifying likely churners among a low churn group. Are they high potential customers worth saving or did we incorrectly placed them in the low churn group?
To resolve these issues we might look into modeling based on variables that are not associates with general transience that low churn segments exhibit. Adverse events, like changes in pricing, service outages, changes in product usage, calls to customer service, all of those need to examined for increased propensity to churn among stable subscribers.
Reactive targeting
We all want to be proactive, but in some cases being on top of reactive game is the next best thing. Addressing long term customers who have raised their hand for attrition is the cheaper option, and it does not carry the risk of accidentally destabilizing your long term customers with the efforts to retain them.
In my experience, a well thought through reactive retention program can prevent attrition both effectively and efficiently. One thing to track is how long the saved customers are staying, and here is where analytics can help by comparing them to a similar group of non-retained customers.
Experiments
When targeting customers, not all segments are equal. While some segments may have a great potential for retention, the end goal of the program is produce a difference in the outcome attributable to the program. This difference in attrition rates cannot be modeled from the predictive model alone, and requires setting up an experiment.
To customize a proactive touch program, the company needs to look at retention rate post contact and compare it to a holdout group that does not get touched. The groups need to be representative, and multiple programs can be tested, presuming the sample size is high enough.
The program report usually looks something like this. It compares post program outcome on representative groups, broken down by segment.
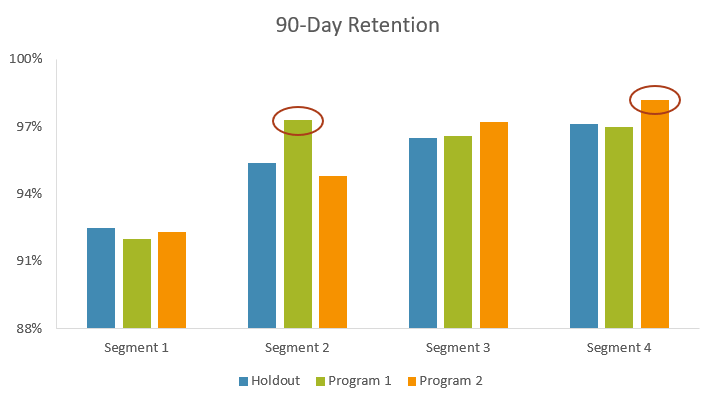
From the report, we can conclude that Program 1 was effective at retaining Segment 2, and Program 2 was effective at retaining Segment 4 and potentially Segment 3.
Using this input, it is easy to optimize the retention program for maximum efficiency.