Marketing Optimization Guide
Marketing optimization is the process of reallocating the marketing budget to drive more profit by investing in highly effective media and cutting the least effective media channels.
Based on my 15+ years of experience in Marketing Analytics, I can attest that it is possible to optimize marketing budgets and cut significant amounts of bloat while maintaining and even increasing sales.
In 2020, Netflix has cut its advertising expenses by 23%, while its revenue soared 24%. Netflix is a mature data-driven company, and while the global pandemic helped lift its 2020 sales, this example shows that companies regularly misjudge how much revenue is driven by their advertising.
But how do you decide which media to invest in and which to cut?
The first step is measuring the effectiveness of advertising. There are two common approaches to solve the effectiveness puzzle. One is more traditional, by tying sales transactions to the media that brought them through direct response or tracking, and the other is an analytical method of estimating incremental sales driven by the medial through experimentation or modeling.
Incremental sales are truly driven by advertising and would not have occurred if the company did not run the marketing campaign. Many sales can be traced to seeing an ad, but not all of them are incremental. To determine true sales incremetality we have to compare sales under different marketing spend levels.
The incremental impact measurement method described in this article is so powerful, it can untangle the web of sales attribution even if your business has complicated, overlapping campaigns run in a variety of media. I successfully used this method at companies deploying multiple regionalized go-to-market campaigns running simultaneously amid the messiness of a large business.
Whether you spend your marketing dollars on social media ads or old-school advertising like radio and TV, you can optimize the expenses in the most efficient way by applying incremental sales analysis.
Let me explain how.
Sales as Marketing Outcome
There are many ways to measure the outcome of marketing spend, from brand recognition to website pageviews, from customer satisfaction to transactions. For the purposes of this article, the goal of marketing optimization is to improve ROI on marketing investment.
To simplify, I am going to disregard price promotions and look at the relationship between marketing spend and sales (revenue).
What is unique about the incremental measurement approach is that it recognizes that marketing spend is not the only variable that drives sales. Outside of general market trends, accumulated brand equity is an important factor that we have to take into account when trying to figure out how much the marketing budget contributes to revenue.
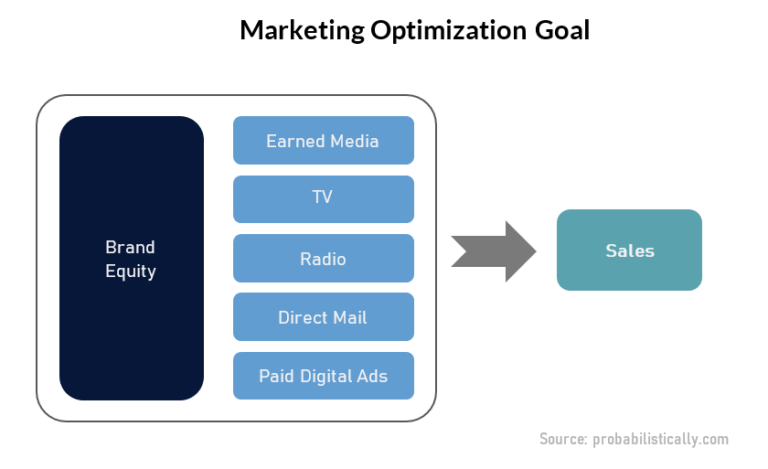
To optimize marketing spend, we should cut the expenses that drive sales the least and invest in the media that drives most sales per marketing dollar.
How to Measure the Impact of Marketing
Before we get into the details, let me explain at a high level the two types of sales attribution approaches used in marketing analytics.
- Incremental impact. We isolate the impact of marketing by comparing sales when marketing spend is at different levels. We can obtain good comparisons using experiments, but in situations when things are messy, it makes sense to deploy modeling and untangle the impact of multiple media channels at the same time.
- Attribution tracking or direct response. We trace a direct line from the customer seeing an ad to sales using response tracking. The revenue is attributed to the media that the customer was traced from, and in the case of multiple touches, we come up with an algorithm to share the credit.
How to Determine Which Approach That Is Right for You
In general, the incremental impact measurement method is where you want to go when measuring the effectiveness of your marketing spend. When available, it is by far more discriminating than the attribution tracking method.
But you already do multitouch attribution! So, you know what is driving your sales.
Wrong!
Let me direct you to the utmost authority on digital analytics, Avinash Kausik, who wrote:
“Incrementality identifies the conversions that would not have occurred without various marketing tactics. Attribution is simply the science (sometimes, wrongly, art) of distributing credit for conversions. None of those conversions might have been incremental.”
I can confirm from my own experience that Avinash is 100% right. Every large company I worked for had trackable sales, but only a small percentage of these transactions was truly driven by the media that “brought” them.
The fact that your customer clicked on a link or called a toll-free number from the mailpiece is not a guarantee that the customer would not have found you through other means. What incremental sales measurement does is flips attribution on its head, and determines the true causality in the marketing-to-sales relationship.
Direct response tracking is great for justifying marketing budgets. Incremental impact measurement is great for optimizing them.
Not every company can implement both methods. Here is the explanation of factors that can make one of these approaches more practical for your particular business.
Brand Recognition
If you have a well-known brand that generates spontaneous sales without advertising, then it is best to use the incremental impact measurement approach.
If your company’s sales would do down to zero without marketing effort, then using the tracking approach is justified.
Precision vs Bias Tradeoff
Incremental impact measurement is inherently less precise because it compares groups without classifying individual purchases.
For example, using the incremental measurement approach we can determine that among 100 transactions only 60 were incremental. However, we can’t pinpoint exactly which 60 out of the hundred were incremental.
This inability to pinpoint the exact purchases often creates the air of uncertainty that is viewed as a weakness of the method.
Don’t be fooled. The power of the incremental measurement method is not in precision. It’s in eliminating bias.
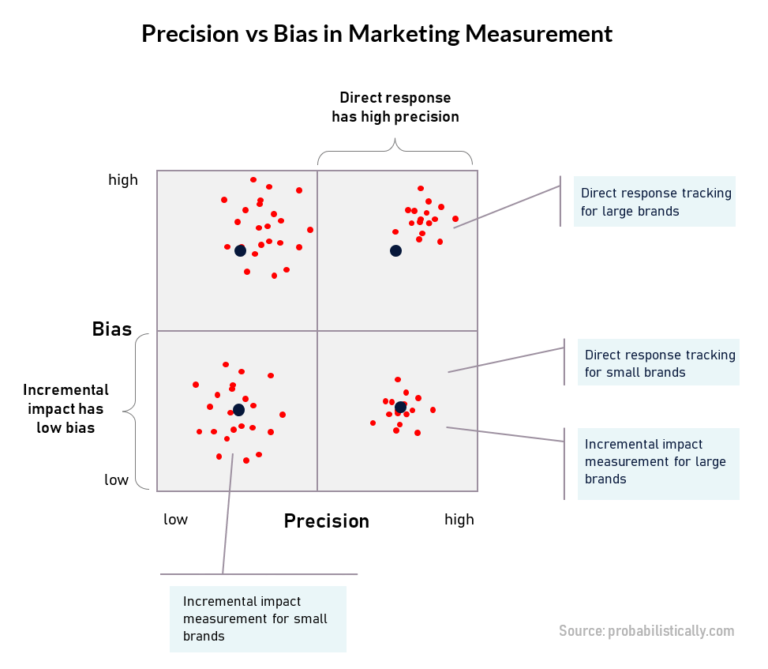
Incremental impact measurement eliminates attribution bias, which commonly happens when spontaneous sales are attributed to a media that the customer was exposed to, even if it did not truly drive the purchase.
Mis-attribution of true drivers is a well-documented issue, particularly in digital advertising. The direct response tracking approach can overstate the impact of marketing by as much as 90% for large brands.
Difficulty of Implementation
The difficulty depends on the type of media that is being measured. For inherently trackable media like digital or direct mail, tracking is easier to implement.
For other media like outdoor, radio, and most of TV, tracking is either impossible or difficult. Here, your best bet is incremental impact measurement.
Marketing Optimization Using Incremental Impact Measurement
Let’s go over the details of measuring the incremental impact of advertising on sales in consumer businesses.
To apply this approach to historical data, you must have varying levels of advertising spend either over time or by geographic area.
If you have spent roughly the same amount per media in every market over the past two years, you may have trouble figuring out its impact from your historical data.
Don’t be discouraged. All you need to do is to start experimenting!
There are two main ways to determine the incremental impact of marketing on sales: experiments and modeling.
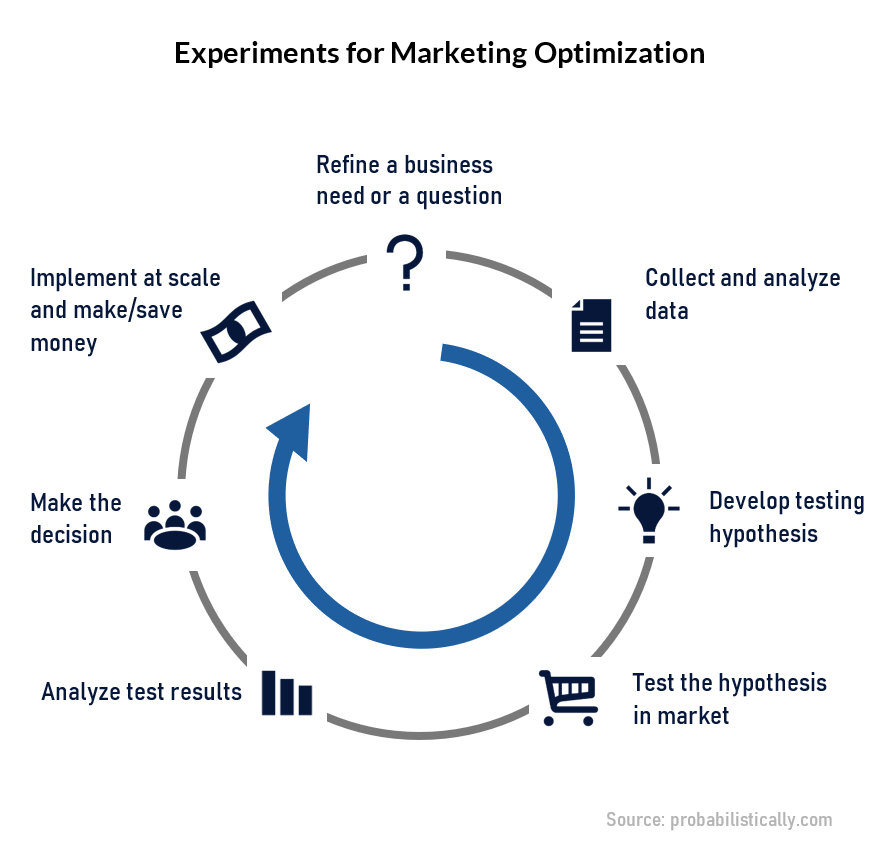
Experiments for Marketing Optimization
Experiments can be intentional or natural. A natural experiment in marketing is when the media spend varies over time, either by media type, customer segment, or geographically.
An example of an intentional experiment is when we find a set of two representative markets in our footprint, double one type of media in one of them for a specified period of time, and then see whether the sales in that geography rise accordingly.
Our double-up market becomes the test market, and its match acts as a control.
Like most companies, you likely have a history of naturally occurring experiments. For example, you may have used a new media channel in the past. If you have tested it in one DMA, you should see if your sales were impacted by this new media (the natural experiment market) compared to the baseline (a matched market).
Look for natural experiments under the following circumstances:
- You operate in similar geographic markets, but you did not advertise evenly in them.
- Your marketing often does not cover the whole market, for example, you use direct mail for a portion of the city or deploy outdoor advertising.
- You use your marketing in bursts, with levels varying widely over time.
- Your sales and budgets took a nosedive due to external factors (like a pandemic) and are not comparable to prior years.
When designing new experiments, you may decide to change the levels of one or more media types. Advanced experiments involving several marketing communications are harder to plan, but they can tell us more about media effectiveness. I wrote more about advanced experiments in marketing here.
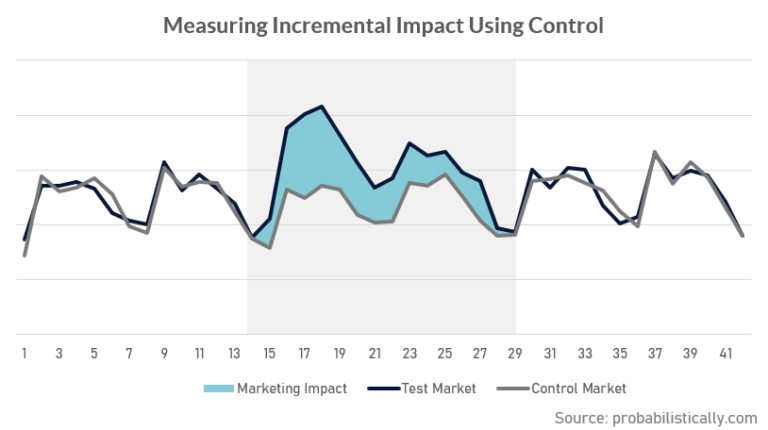
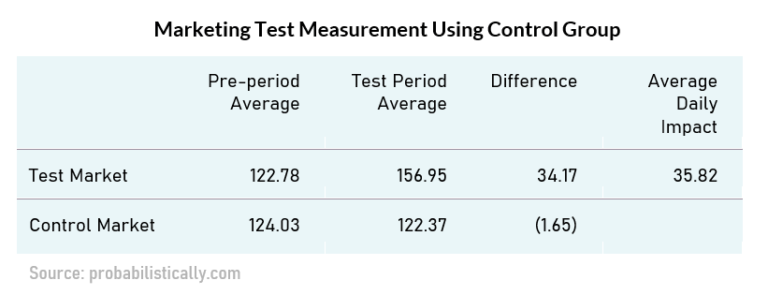
When you calculate the impact of marketing in a typical test vs control experiment, you will need to make sure your groups have a similar sales dynamic before your experiment started.
You can either measure your sales in units, dollars, or as year-over-year percent change to account for seasonality. Just apply the metric the same way to both markets/groups.
The sales in the test (experiment) period are compared to the sales in the pre-period, and the control group serves as a baseline of what you should have expected at the time of the test in the absence of the test media.
Below is an example of how to calculate the impact of your marketing change on the test market.
Marketing Optimization Using Modeling
Marketing Mix Modeling is the gold standard of marketing ROI measurement. This type of model uses media spend data from the prior periods, usually two years, to determine the contribution of every marketing channel to company sales.
Marketing Mix Modeling is justified if you:
- Use multiple types of media, and the levels are varying over time or by geography.
- Have over two years’ worth of clean data.
- Are present in multiple geographical locations, but you feel like they may not be representative of each other.
- Have trouble finding good natural experiments to analyze.
Modeling comes in handy when you have too much marketing data to analyze. If you are active in multiple markets, not all of them comparable, and you have different media running at different levels at different times, your best approach is a Marketing Mix Model.
Modeling is a more involved method, and many companies employ outside consultants to run these projects. However, most of the modeling work is in collecting and formatting the data, so if you decide to build your own Marketing Mix Model, you will learn a lot even if your model is imperfect.
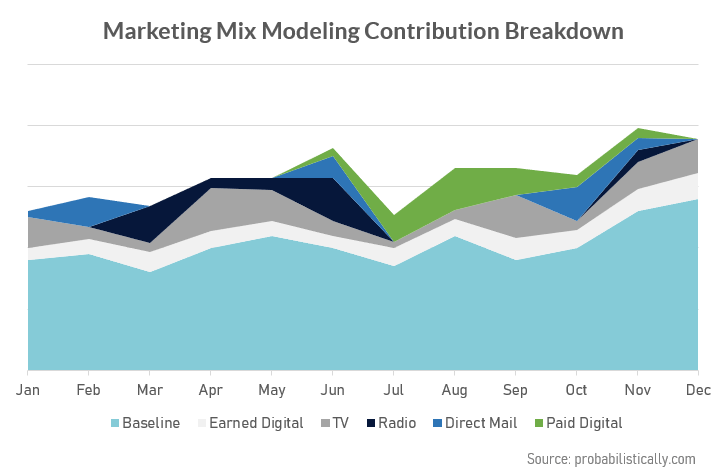
The inputs for the model are the levels of marketing spend in each geographic market in each period (usually a week or a month), and the output is the sales in those markets, often expressed as a year-over-year percent change.
The baseline sales are the spontaneous sales that would happen if your company turned off all of its marketing. These sales are attributed to your brand equity.
For well-known brands, it is not unusual to see as much as 90% of sales to be baseline sales.
Now that you know the theory, let’s implement it.
Marketing Optimization Process
Follow this process to optimize your marketing budget using data analytics and experimentation approach:
- Collect data about past marketing spend and sales.
- Analyze the past impact of marketing and make preliminary conclusions about the effectiveness of different media.
- Reallocate budget from the least to the most effective media in the next period.
- Create a testing plan, where you intentionally test different levels of spend to determine its incremental impact.
- Make adjustments to your spend after you get the results of your tests.
- At the end of the quarter, analyze overall marketing spend to find new reallocation opportunities.
Let me go over important elements of the plan in more detail.
Data
The level at which you need to collect the data is the type of media, location, time period. The media levels can be expressed as GRPs, Paid Clicks, Views, or $ spent.
The target variable (sales) needs to be broken down for the same time periods and geography as the media spend.
Analysis
Natural Experiements. Your goal is to find similar groups that had higher and lower media spend, and then you compare sales that came from these groups.
Modeling. If you decide to create a Marketing Mix Model, hire a qualified analyst or a consultant who has done it before.
Remember that you are analyzing the marginal impact of your media, i.e. you can’t measure the total impact of your media unless you are able to turn the media off completely.
Budget Reallocation and Test Planning
Create a control group for every media you change. A control group is usually a geographic location where you leave your spending at the original level.
As the year progresses, you can measure a change in sales due to the budget reallocation by comparing your control to the most similar market.
This should give you an idea of what drives the trajectory of your sales, your new marketing spend or external factors.
Strategic Testing
If you have not run media experiments before, you should absolutely do it and put them on your marketing plan going forward.
You can run a number of strategic experiments to further understand the effectiveness of your marketing. Here are some marketing experiment ideas:
- Intensity, frequency, or level measurement. Choose several representative groups and run different levels of media for them to figure out the optimal level of investment. For example, I ran a direct mail frequency test where representative groups of targets were mailed every one, two, four, and six months to understand the optimal frequency of contact.
- Segment testing. Run drastically different levels of the same media in two large representative groups or markets. Cut the results by demographic or other segments to see who is most susceptible to your advertising.
- Media cannibalization/support test. This test determines whether running two media types together is more or less effective than running them separately or consequently. You will need four representative groups: two groups each exposed to one media type, a group that gets both, and a group that gets neither.
- Universal control group. That is a group that does not get any media. It serves as a baseline for all of your advertising put together. Read about more examples of how to test using a universal control group here.
Ongoing Review
Once your reallocation period starts, you should be able to assess how much revenue your marketing is bringing in by comparing your groups. As I already mentioned, your control group is critical in this assessment.
If you are running additional intensity tests, you should be getting a better idea of where the optimal level of marketing spend is.
Summarise your results every month and decide if you need to make changes to your spend levels.
If you do decide to make changes, don’t forget to figure out how you are going to measure the performance of your new marketing plan going forward.
Quarter End Review
Congratulations, you have made it! I hope you were able to increase sales on the same or lower marketing budget. Now is the time to review the results and make plans for new tests in the next quarter.
Marketing Optimization Tips from Practitioners
- When starting, answer the big questions first. “What happens if we stop using media X for a year?” is a more valuable test than figuring whether a green or a red button converts better.
- Control groups can be used for both strategic testing and measurement of ongoing programs. If you have the sample size, use control groups everywhere. No marketing campaign has ever been hurt by a control group.
- Optimize the balance of media types first (digital vs. tv vs. radio), then conduct experiments to determine the segments that you need to target.
- Marketing mix modeling is a good way to balance media types. Experiments are great for fine-tuning spend within one media.
- If you only have used direct response tracking to assess effectiveness in the past, you will be in for a surprise. Highly trackable media often bring little incremental sales because they are the easiest to justify expenses for. Read this article about how mind-blowingly misleading digital ad tracking can be. No, seriously, read it. It’s an amazing article.
- Don’t be surprised that you don’t see a difference between markets or groups that get drastically different levels of media. Many companies act safely and overspend on marketing. Keep growing the gap until you see a difference.
- When trying out control groups for the first time, many companies make common mistakes. Read this post to learn more about how to choose good controls.
- Simplify your advertising. Most companies serve a narrow market that does not justify highly targeted or personalized offers for every segment.
- Think about marketing frequency, not just coverage. Reducing frequency saves money while being easier on sales.
- Make sure you use a solid methodology to calculate marketing ROI. If you have an amazing ROI for every program, but your sales don’t grow, your approach is problematic.
- If you have to use customer lifetime value for your ROI calculation, be conservative with the expected length of the relationship. Many marketing programs don’t create a new customer out of thin air. Rather, they move the beginning of the relationship forward by a few months.
- When analyzing natural experiments pay close attention to how representative your groups are. Here are some tips.
- Try retention marketing. Retaining existing customers is less sexy than bringing in new business. What is less sexy is typically more effective.
Direct Response Tracking for Marketing Optimization
Direct response tracking works well when the sales volumes are low, and you can honestly attribute your sales to the channel that facilitates the transaction, i.e. last-touch attribution.

Here are my tips on how to make the most out of your direct response tracking to optimize your budget.
Make Sure Your Tracking Goes All the Way to Sales
Toll-free number calls, click rates, and open rates are often used as benchmarks for tracking, but they don’t tell the whole story. There could be a difference in sales conversion rates for these media channels that the company is not aware of.
For example, upsell direct mail for a cable company gets a high call rate despite having a low sales volume. It happens because customers call the toll-free number on the mailpiece to report service issues or to ask billing questions.
To get the most out of tracking, you have to know how many purchases your clicks are bringing.
Use Tracking to Understand Customer Journeys
Different media usually attracts different types of customers. They look for specific things, and they don’t follow the same path through the purchase funnel.
Look at their journeys through the lens of the channel these customers come from, and you may be able to understand them better. Use this insight to remove barriers to purchase and improve conversion rates.
For example, it’s common for expert consumers to use websites for research and to order niche products. Casual customers tend to look up retail store locations, where they can buy the most popular product in person. Use this dynamic to target your customers accordingly.
High Conversion Rates Do Not Equal Most Profit
Some sales are better than others. The difference in revenue and profit is often inherent to the customer segment.
Here is a telecom business example. Customers who change their providers every 10 years are by far more profitable than subscribers who switch every six months.
However, those who switch every six months have a [100% / 6 =] 17% monthly connect rate, and those who switch every 10 years have a [100% / 120 =] 0.8% connect rate.
As a marketer, would you want to target someone who has a 17% chance of making a purchase in the next month or a 0.8% chance?
That’s why marketers often chase short-term switchers, while more profitable segments are being neglected because of their low conversion rates.
Use Free Tools
Google Analytics is a powerful tracking tool, and with GA 4.0 you are getting an amazing resource for your decision-making for free.
Do you find the Google Analytics interface rigid? You can analyze Google Analytics data in Google Data Studio in real-time. Find a template that you like online, connect Google Analytics to your Data Studio template, and you are good to go.
Look for Ways to Get Free Advertising
Create compelling content to get free media. This is very relevant for social media and search rankings.
To get free traffic from Google, look for ways to improve your SEO for niche terms in your industry.
On social media, it’s all about adding value to the conversation. Use education, humor, and entertainment to achieve greater visibility.
Simplify Your Marketing
Personalization may be en vogue, but I have rarely seen it deliver better results than common sense customer segmentation. Most businesses operate in a narrow niche and don’t need to create multiple versions of marketing campaigns or deploy elaborate targeting schemes.
A clear explanation of what differentiates you is the key to creating persuasive advertising that works for most targets.
Beware of Low Quality and Fraudulent Ads
There is an epidemic of digital ad fraud. You have to be extremely sophisticated to understand all of the technology behind it. Even digital-native companies like Uber were not able to avoid buying millions of dollars in fraudulent clicks, and my hopes are not high for the rest of us.
My recommendation is to limit your digital ad buys to reputable publishers, like Google, Facebook, and the New York Times.
Conclusion
There are several tried and true analytical methods to understand the effectiveness of the media and to optimize marketing spend for sales growth.
Marketing effectiveness measurement can be as simple as running a market-level experiment or as complicated as a Marketing Mix Model. You may get away with using very little historical sales data or having to clean up and validate all of the marketing data for the past two years. There is a solution for every level of data literacy and involvement, and all you need is to find your sweet spot today so you can drive more sales tomorrow.
If you would like to discuss how to use incremental sales measurement and response tracking methods to maximize the effect of your marketing programs, be sure to connect with me on LinkedIn or send me a message through the website. You get extra points if you want to talk about experiments. I love experiments.

by Tanya Zyabkina
Tanya Zyabkina has over 15 years of experience leading analytics functions for multiple Fortune 500 companies in the retail and telecom industries. Her experience spans from qualitative market research in the fashion industry to determining the impact of promotions on subscriber behavior at a cable provider.