
Measurement of overlapping campaigns when using controlled experiment design has been a bit of a tricky point for many controlled experiment proponents. Some claim that you have to hold other campaigns when measuring, which is a difficult proposition, especially if the goal is to measure every campaign that the company runs.
My position is different. You have to both test and measure campaigns exactly as they are supposed to be run in the messy real life world. It makes no sense to measure a campaign under laboratory conditions only to see that it is not nearly as effective when implemented in the real world.
The question is whether controlled experiments can help us correctly measure the effectiveness in messy conditions.
Let’s consider a simple example first.
For instance, what if we have two overlapping communications that go out to the same audience at the same time?
Simple Overlapping Campaign Experiment
Assumptions:
- Both communications target the same exact customer group, i.e. there is a 100% target overlap.
- The communications’ response windows fully overlap.
- 10% control (holdout) group is randomly carved out of each target list; these groups do not receive the respective communication but may receive “the other” communication.
- The incremental impact of each campaign is a 2% increase in sales over the baseline (i.e. spontaneous level).
- The impact of two communications is fully additive – customers that receive both communications respond at 2%+2% = 4% incremental level.
- Both campaigns are measured by comparing sales of the treatment group to its respective control group.
First, let’s see who in the target audience gets what.
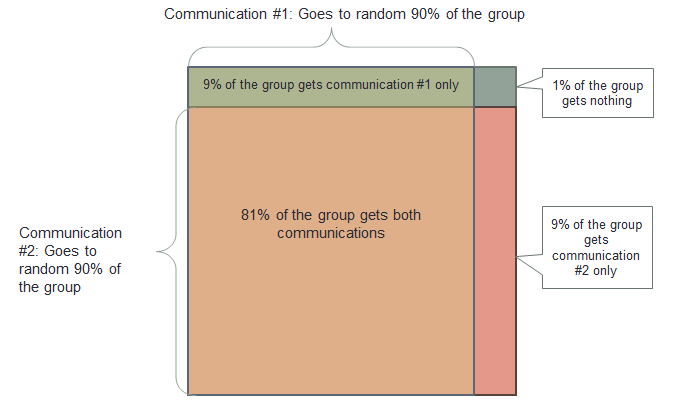
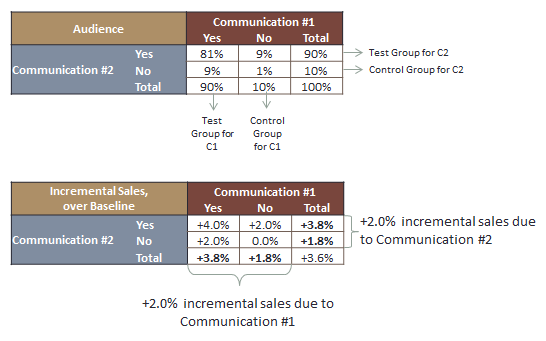
This breakdown is going to result in certain levels of incremental sales in each group, and we can use them to determine what our controlled experiment is going to produce.
As you can see below, simple math shows that the controlled experiment design resulted in a flawless assessment of incremental sales for both campaigns.
This was a simple example. Now lets up the ante and remove some of the assumptions and see what happens.
Generalized Overlapping Campaigns Measurement
Assumptions:
- The communications’ response windows fully overlap.
- Both communications target a similar group, with some variable overlap.
- Variable percent control groups are randomly drawn out of each target list; these groups do not receive respective communication.
- The incremental impact of each campaign is an increase in sales over baseline (i.e. spontaneous level), and can be varied between communications.
- The impact of two communications is not fully additive – customers that receive both communications can respond on a level that is lower or higher than the sum of both.
- When determining incremental sales of a campaign, we need to find not the “clean” lift that happens when the campaign is run by itself, but the adjusted incremental sales, polluted by having the other campaign in the marketplace.
- Both campaigns are measured by comparing the sales of the treatment group to its respective control group.
Since it is a more robust design, it needs a more robust setup. I have created an Excel file that you can download and play with all of the assumptions of the model to see what result a controlled experimental design produces.
The bottom line: controlled experiments can be used to accurately measure the real incremental impact of overlapping marketing campaigns.