How to Determine Customer Churn Rate
In this article, I am going to use my experience as a Director of Retention Analytics for a major US cable company to explain how to define and calculate the customer churn rate that will work for your business.
I will go over the definitions of metrics used in the churn rate calculation as well as closely related terms such as attrition and survival rates.
Lastly, I will provide recommendations on how to report on churn metrics.
Customer Churn Rate Definition
However, there is a lot of industry-specific nuance in churn rate calculation. Let’s break the calculation apart and look.
Active Customer Definition
The definition of an active customer is at the core of the churn rate calculation. Customer status is a snapshot metric, i.e. it can only be measured on a particular date. In other words, a customer can be active on one day, but inactive on a different date.
It’s impossible to determine if a customer is active without specifying the date when the customer must be active on. Trust me, I had this conversation many times.
The distinction between active and inactive status can be clear for some businesses, but others may have to give it more thought. For example, is a customer who receives a free service an active customer? You must answer these questions in order to define an active customer and customer churn.
Customer Churn by Type of Business
Businesses can be roughly typed as subscription or transactional.
Subscription businesses sell services that cover a period of time, like telecommunication services, banking relationships, insurance coverage.
A subscription customer is considered to be active during the coverage period, and inactive outside of it.
Transactional businesses sell products by individual transaction, which don’t form a subscription. For example, retail purchases, restaurant meals, home renovations. They usually price their offering per product or service.
For transactional businesses, an active customer on a certain date is defined as someone who had had a transaction within a certain period of time of that particular date. Therefore, to define an active customer in a transactional business, you need to define the active customer window.
For example, if you define your active customer window as the prior 90 days, then active customers as of January 1, 2024 are every customer who had a transaction between October 3, 2023 and January 1, 2024.
While churn rate as a metric makes the most sense for subscription businesses, it is also applicable to transactional businesses. Sometimes transactional businesses use different terms for churn, which I will note.
Customer Churn Definition
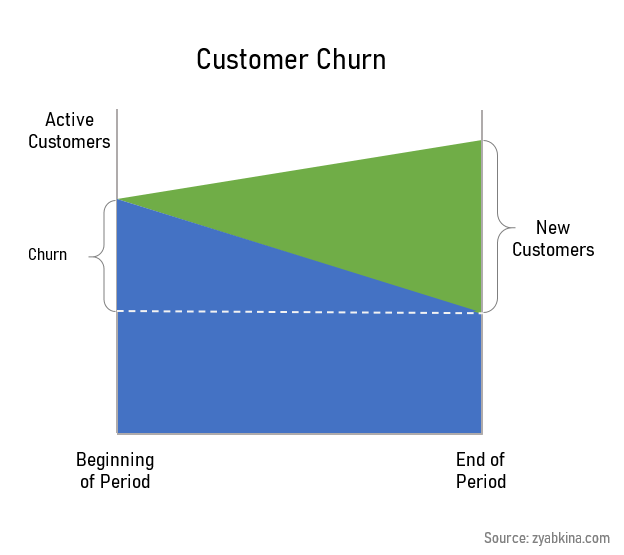
A customer is considered to have churned if they go from active to inactive during a specified period of time.
Thus, churn is a count of customers that went from being active to being inactive during a specified period of time. Churn is a flow metric, and thus must have the beginning and the end of the period specified.
The metric seems straightforward, but practice shows that its interpretation can be different in different businesses.
For example, some cable systems count customers who transfer service to a new address as churned, and some don’t. I have also seen situations when the definition of churn changes over time, usually to fit certain narratives put forward by the businesses.
It is important to keep the definition of churn consistent, over time and across company divisions. Your definition of an active customer should guide you on who should be truly counted as a churned customer.
Some transactional businesses add another status in between active and inactive, called lapsed. A customer would go from an active status into lapsed, and then into churned based on how long ago they had their last transaction.
Customer Churn Rate Definition
Customer churn rate is the number of customers who went from being active to being inactive dirung a specified period of time divided by the number of active customers at the beginning of that period.
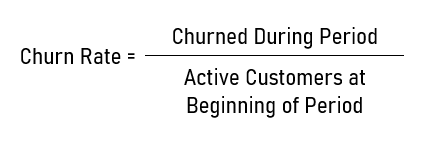
The number of active customers is often called the active customer base. Thus, the churn rate over a period of time can be expressed as total churn during that period of time divided by the active base.
Commonly, the churn rate is calculated on a monthly basis, but there are also weekly, quarterly, and annual churn calculations.
Churn vs Attrition
Did I mention the churn rate can be tricky?
Let’s look into the tricky part.
Even though this customer churn formula is precise, there is some uncertainty about how you treat customers who became active and then went inactive during our measurement period.
For example, if we measure the churn rate for the month of June, how do we treat subscribers who were not active at the beginning of June, became active during the month of June, and then became inactive again by the end of June?
Often, we would disregard these customers because their number is low. In this case, our formula can be simplified.
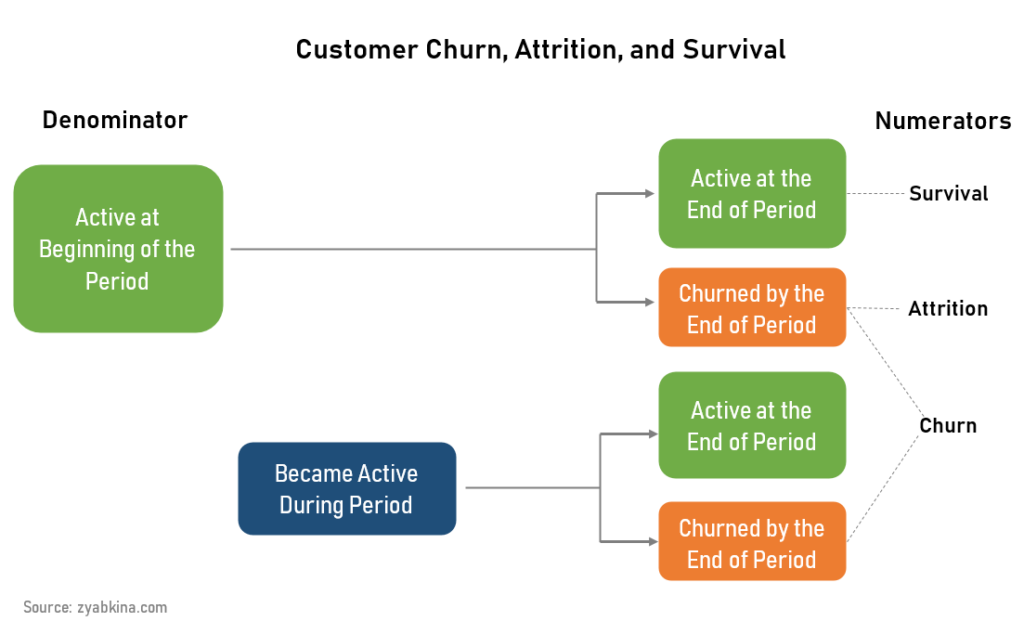
Attrition rate is the number of customers who were both active at the beginning of the period and inactive at the end of the period, divided by the total number of active customers at the beginning of the period.
The numerator in attrition excludes customers who were not active at the beginning of the period, thus not counting new customers who became active and then went inactive all within the measured period of time. Attrition rate is always lower than the classic churn rate.
Attrition rate diverges from churn rate when measured over a longer period of time, for example over a year.
Many customers do a “round trip” during a year, and thus including them into annual churn rate calculation is essential. However, these customers should not be counted in the numerator, which is the count of active customers at the beginning of the period.
Churn and attrition rates are two ways of looking at the churn and they provide us with different views of the business. Both offer a unique perspective.
Practically speaking, it is easier to analyze the attrition rate as an approximation of the churn rate. If you are using short analysis (week, month) periods and rarely get “round trips”, then simplifying the analysis is not a problem.
There is a lot of detail that goes into churn, and that’s why you should always ask exactly how the numbers were defined when presented with the churn, retention, or attrition rates.
Monthly vs Annual Churn and Attrition Rates
Every business is seasonal, and customer churn is not an exception. Be prepared to see different churn rates in different months of the year.
If you are using the classic definition of the customer churn rate, for some businesses this churn rate may exceed 100%. It’s not a concern of its own, but the nature of your business must be quite transient if your annual inactivations exceed your active base.
Unlike the customer churn rate, the attrition rate can never go over 100%.
The opposite of attrition rate is survival rate. Survival rate is the percentage of customers who were active both at the beginning and at the end of your specified period.
In transactional businesses, survival rate is often called repurchase rate. This comes from the fact that to stay active, the customer needs to make another transaction.
What is a Good Churn Rate for a Telecom Company?
Most telecommunication businesses have a monthly churn rate of around 2%. This number represents the whole customer relationship, not the the individual product churn rate.
However, different subsegments of the business may have vastly different churn rates. For example, I have seen rates as high as 8% a month and as low as 0.5%, which I would consider being normal. Since tenured subscribers are less likely to churn, the disconnect rate for those who have been around for five years tends to be very low.
Another factor to consider is the churn reason. Based on my definition, churn is reason-agnostic, covering all reasons for disconnects. While many articles presume that churn only happens due to customer non-satisfaction, in reality, this is not the case.
For example, as much as 30% of early churn in the telecom industry happens due to non-payment. Another big chunk of disconnects is due to customers moving to a different area.
These reasons need to be paid attention to when calculating and reporting churn rates.
Churn Rate vs Customer Tenure
For subscription businesses, customer tenure is one of the largest factors impacting customer churn rate, with the churn rate going down over the tenure of the customers in all businesses.
I describe this dynamic in great detail in my churn analysis article, and I highly recommend doing tenure analysis as the first step of churn analysis.
Customer Churn in Transactional Businesses
In place of tenure, transactional businesses use recency, frequency, and monetary value metrics, sometimes abbrviated as RFM. These metrics are also aimed at understanding how engaged the customer is with the product and how likely they are to continue purchasing.
The function that tries to increase customer life in transaction businesses is called loyalty. Its goal is to make sure the customer repurchases the company’s product as long as possible.
Churn Rate Reports
For a subscription business, the following churn reports make the most sense. All of these metrics should be run for at least 13 months because churn is seasonal, and we need the prior year’s baseline to compare to.
- Total churn rate
- Churn rate by product line
- Churn rate by customer tenure
- Churn rate by reason
- Churn rate by region
Conclusion
Churn rate can be calculated for both subscription and transactional businesses. There are multiple ways to calculate churn rate, and there are other similar metrics that can be looked at, such as attrition rate, survival rate, lapsed rate, recency, frequency, etc.
Now that you learned how to calculate the churn rate, it is time to analyze churn. Hop over to this article to learn more about churn analysis. If you need help understanding your churn data, please connect with me on LinkedIn and send me a message.

by Tanya Zyabkina
Tanya Zyabkina has over 15 years of experience leading analytics functions for multiple Fortune 500 companies in the retail and telecom industries. Her experience spans from qualitative market research in the fashion industry to determining the impact of promotions on subscriber behavior at a cable provider.