
The goal of adopting data-driven approaches in business is to make better decisions. Raw data is hard to interpret, so we engage the help of analytics, a function that turns data into business insights and recommendations.
In my 15 years of work in the Marketing Analytics function, I oversaw a wide variety of projects. They can be broken into descriptive, predictive, and prescriptive analytics based on the end goal of the analysis.
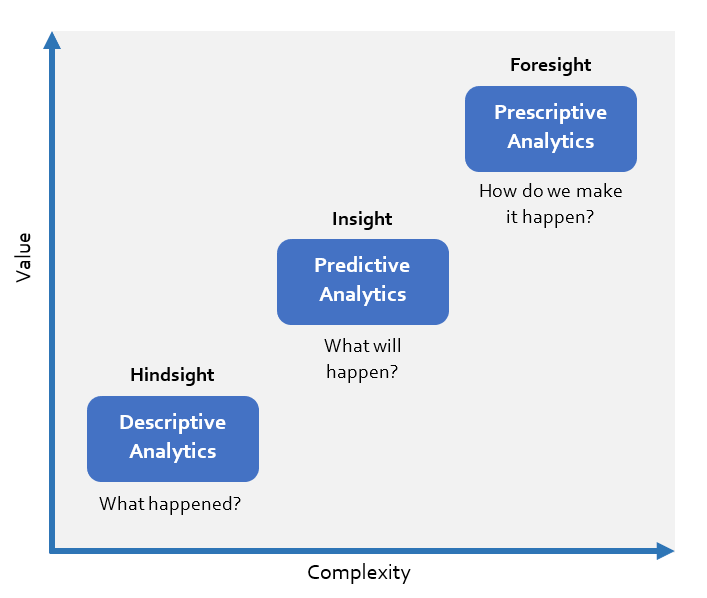
Descriptive analytics identifies factors that are correlated with your desired outcome, so you can better understand the impact of these variables by analyzing trends over time, comparing different geographies and categories. Descriptive analytics puts your data in context.
Predictive analytics takes the variables that descriptive analytics has found to be influential, and makes informed predictions about future customer behavior. Contrary to common assumption, it does not inform about the actions that you need to take to change that prediction or behavior.
Prescriptive analytics measures the incremental impact your actions make on the outcome. You can use it to find the best programs and campaigns based on the difference they make compared to what would have happened otherwise.
I will use a marketing example to walk you through the three types of analytics.
Introduction
Imagine that you work as an analyst for a retail home furnishing company, think Pottery Barn or Wayfair. In the past 4 months, Company’s sales have been down 5% on a year over year basis. The company would like to understand the drivers of the decline and get data-driven recommendations on how to improve future sales. Below are the examples of descriptive, predictive, and prescriptive analytics that you can perform to identify drivers of sales and develop guidelines for future actions.
Descriptive Analytics
You have been asked to identify the drivers of the sales decline.
In this analysis, you first look at whether you can identify any patterns in the sales decline itself, by breaking year-over-year sales by regions, product categories, and types of stores and customers.
When you find patterns that appear to be meaningful, you look for additional variables that may explain the patterns.
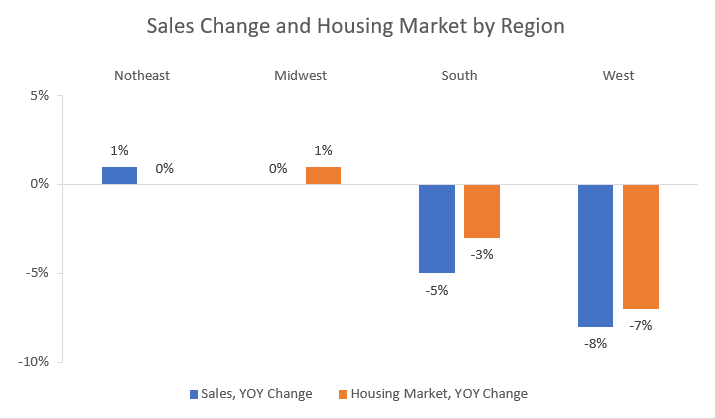
You find that the sales have been down the most in the West and the South, and the decline seems to be related to the slowdown in the housing market in these areas.
This is an example of analysis you may run to show it:
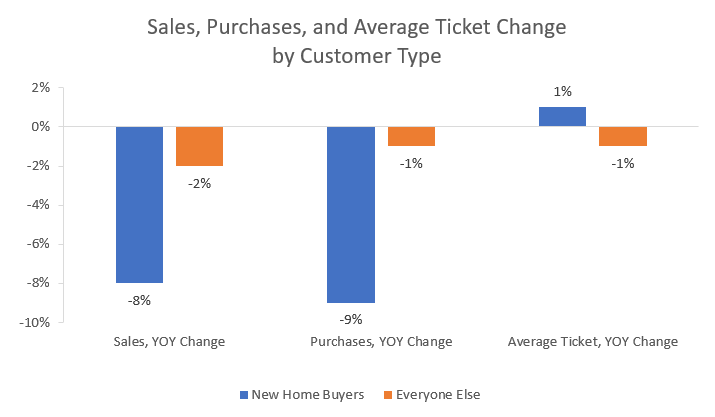
To further investigate your hypothesis that the decline is driven by the housing market, you decide to tie sales to home buying at a customer level.
Your company has access to the residential real estate sales database, so you are able to identify households that purchased a house within 6 months prior to their transaction. You confirm home purchasing as the reason for the decline by looking at sales, transaction counts, and average ticket against two different customer segments.
Predictive analytics
You have been being asked to find customers most likely to purchase from your store.
You can use the data that you found in the descriptive analytics stage to correlate with sales to estimate the likelihood of a customer making a purchase. This predictive model will use binary (yes or no) historical outcomes to determine the factors leading to a purchase at a household level.
The model estimates the likelihood of any given household to purchase from your store in the next 90 days, and it’s often called a purchase propensity model.
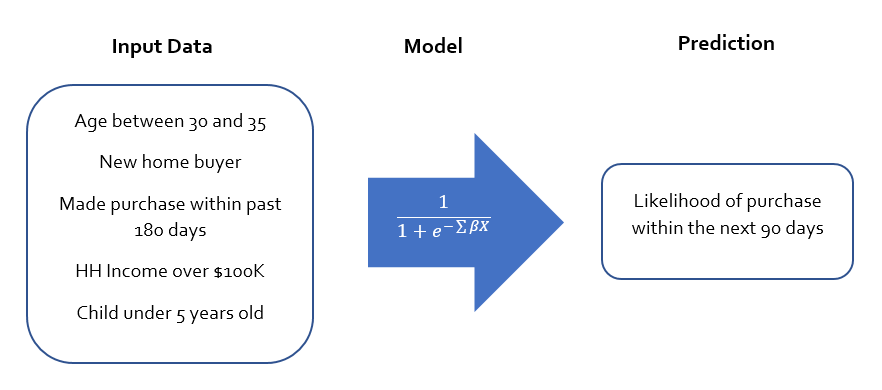
After creating the model, you run your prediction of purchase in the next 90 days for all eligible households in your database. You can sort your household file by the likelihood to make a purchase, and then divide your potential targets into groups (quintiles, deciles) based on the propensity.
Most companies target those in the top propensity group with offers. However, there is nothing in your model that indicates that these customers’ propensity to buy is increased by receiving a coupon or catalog. And while targeting your top prospects is often justified for little-known brands, the situation is different for well-known brands where the spontaneous purchase rate is high.
After all, you can only assess households’ likelihood to make a purchase from your brand, and not from competitors, so those extremely likely to make a purchase from you are your most loyal customers, and targeting them can be like preaching to the choir.
To address this conundrum, you need to engage in prescriptive analytics. This kind of analysis looks at the effects of a company’s actions on purchasing behavior.
Prescriptive analytics
Prescriptive analytics aims to optimize outcomes by evaluating different actions and using analytics to assess the outcome.
If you already created a predicitve model, there are two types of actions the company can take: 1) an action that matches your prediction operationally and helps save the company money by improving efficiency; and 2) an action that impacts your prediction by changing the customer behavior.
Changing customer behavior by encouraging customers to buy more than predicted falls into the latter type.
As an analyst, you have been asked to look at how different marketing programs can increase the likelihood of households making a purchase. The company would also want to know which customer segments are the most promising for targeting.
Because you need to assess a change in purchase propensity, you cannot just use your predictive model to figure out who should be targeted. Instead, you need to conduct an experiment where some households are being targeted, and some are not. This way you can look at the difference in purchase rates that the marketing programs produce.
This type of experiment is called a controlled experiment, and it is similar to an A/B test, except one arm of the test is not getting targeted. I am simplifying the assignment by ignoring the frequency, cadence, or intensity of the marketing effort to make the example easier to understand.
Ideally, this experiment would split eligible households randomly into targeted and control groups. Our outcome is whether the household made a purchase in the period following the marketing campaign. Once we run the test and tabulate the results, we can segment the outcome by the predicted likelihood of purchase, but also by other factors.
Here is an example of a simple test result split by homeownership and length of residence:
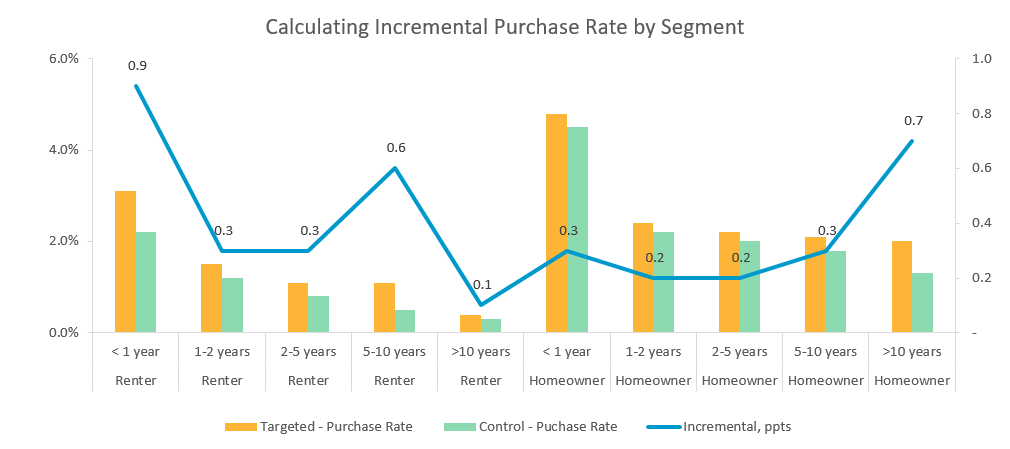
As you can see, the difference in purchase rates is not always correlated to the purchase rate itself. In our example, early tenure renters, renters that have been at the residence for 5-10 years, and long-term homeowners were most likely to make an incremental purchase, a purchase that would not have happened if we did not run a marketing campaign.
Experimentation is often the key to producing reliable prescriptive analytics, and the work product can be a simple comparison report as well as a prescriptive model.
In our case, if the company wants to engage in more advanced prescriptive analytics, it can create an uplift model.
Another popular way to apply prescriptive analytics in Marketing is Marketing Mix Modeling. This type of model uses marketing investment and other operational and macroeconomic variables as inputs, and sales as an output. Sales are being explained by the variation in advertising spend.
The controlled marketing experiment can be considered the most simple, one-factor Marketing Mix Model. Since all other factors are going to be exactly the same for both targeted and control groups, the difference in sales is driven by the marketing program.
While Marketing Mix Modeling can help with high-level rebalancing of the marketing investment among the different types of media (TV, radio, digital, outdoor, etc), experiments add precision to this optimization at a lower level.
Prescriptive analytics evaluates the impact of a company’s actions on its bottom line with the goal of optimizing programs to deliver the most value.
Myths about the three types of analytics
1. Prescriptive analytics is more complicated than predictive analytics.
In reality, the opposite is often true. Predictive analytics uses modeling, while many types of prescriptive analytics can be accomplished using experimentation.
2. Prescriptive analytics can only be done after predictive analytics.
While it is not uncommon for the progression to go from predictive analytics to prescriptive analytics, it is possible to skip the predictive analytics step and go directly to prescriptive analytics. The experiment and subsequent segmentation of households in our example can be done without a predictive model.
3. Descriptive analytics is less valuable than predictive/prescriptive analytics.
This myth is based on the false assumption that the fancier the math, the more valuable the outcome. Not only is this not true, but some predictive models can be replaced with smartly chosen descriptive analysis coupled with reasonable assumptions about future performance.
The value of analytics is not limited to making predictions. What many analytical projects offer is an insight into how the business works. This knowledge can be applied directly to making informed decisions as well as leveraged in other types of analytical projects.
Descriptive analytics reveals correlations and interdependencies within the data (in our example, between sales volume and housing market changes) that can be valuable on their own. Conversely, predictive and prescriptive models can be complicated black boxes, where we can’t tell which factors play an important role in the prediction.
4. Prescriptive analytics must use machine learning or AI.
While some types of prescriptive analytics use advanced methods (recommender systems, Marketing Mix Models), the use of the advanced methods is not warranted for prescriptive analytics at most businesses. The idea that machine learning and AI are a must for prescriptive analytics seems to originate with vendors trying to sell over-engineered solutions.
Conclusion
Descriptive, Predictive, and Prescriptive analytics are different based on the goal of the analysis, rather than the methods. They offer different insights into how a company’s operations and sales can be improved.
Business leaders should match the type of analytics to the questions they are trying to answer and the decisions they need to make.
While prescriptive analytics is the ultimate goal, since it provides specific guidance, most companies get stuck creating and perfecting predictive models and forgetting about the power of experiments.
Consulting experienced analysts and engaging them early in the process to set the right goal is more important than pursuing a specific method or model.