The relationship between predictive and prescriptive analytics can be confusing, and for a good reason. Not only these types of analytics are complicated, but in some industries the dividing line is blurry.
In this article, I will use my 15 years of experience in analytics to explain the difference between these two types of analysis and provide examples of both.
Definitions
Predictive analytics predicts which outcome is the most likely.
Prescriptive analytics estimates the impact of your actions on the outcome and recommends the action that is most likely to produce a favorable result. It measures the incremental effect of an intervention.
How are predictive and prescriptive analytics different? Predictive analytics makes a forecast about the baseline, and prescriptive analytics estimates how much you can change that baseline with your action.
3 Differences between Two Types of Analytics
| Type | Predictive Analytics | Prescriptive Analytics |
| Essential method | Modeling | Experiment |
| Estimate | Score that reflects the likelihood of an event | Incremental impact of company’s action on the output metric |
| Data | Customer level attributes and outcomes | Compares outcomes when different action is applied |
Difference Explained
Prescriptive analytics is presumed to be more sophisticated than predictive analytics. While the thinking behind prescriptive analytics is more advanced, the analytical methods don’t have to be. Often, actionable prescriptive analytics can be produced using simple methods.
The word ‘prescriptive’ comes from the word prescription. How does medical science decide what to prescribe a patient? It’s based on clinical trials. A trial, or experiment, is a way to determine causality between an action (treatment) and the outcome.
This is very much how prescriptive analytics approaches the problem, e.g. let’s find an action that changes our outcome to a more favorable one.
In contrast with predictive analytics, which estimates who is most likely to develop a certain condition, prescriptive analytics figures out how to treat that condition best. This is how these two methods can be combined and used together to improve the results.
Blurry Lines
Why in some industries prescriptive analytics is very similar to predictive analytics?
It’s simple.
Sometimes, we don’t want to change the outcome. We just want to make it run smoother and more efficiently.
For example, take Amazon. It may build a predictive model to tell how many deliveries will need to be made to customers in a zip code every day. Then, it can use this prediction to schedule drivers and optimize delivery routes. The prescription (scheduling) is based directly on the prediction.
However, if Amazon tries to get more sales or gross margin by changing product prices, it would have to run experiments and determine price elasticity, i.e. how much pricing can change the predicted baseline demand. In this case, the prescriptive analytics is different from the prediction.
Sometimes, the line is not obvious. If you run a predictive model for equipment failure, you should be able to send out a maintenance crew and act upon that prediction. However, you might do additional modeling and experimentation to find out when exactly to send out the crew to balance the costs of maintenance logistics, replacement equipment, outages due to failures.
As a general rule, if we are trying to change the outcome, then predictive analytics is different from prescriptive analytics. If we plan to act based on the prediction directly, then prescriptive analytics flows from the prediction.
Examples of Predictive Analytics
Most predictive analytics is done using modeling. However, it’s not a hard requirement. You don’t have to have a model to run a predictive analysis.
For example, if you notice that your sales have grown 2% on a year over year basis in the last two months, and you think this trend is going to hold for another month, then increasing your last year’s sales by 2% can be your prediction.
Don’t underestimate simple forecasting methods like this. They are used widely and effectively in many companies. Their advantages include being transparent, easy to understand, and inexpensive to implement.
But that’s not why you came here. Let’s talk about fancier methods.
Three Most Common Types of Predictive Models
Propensity models
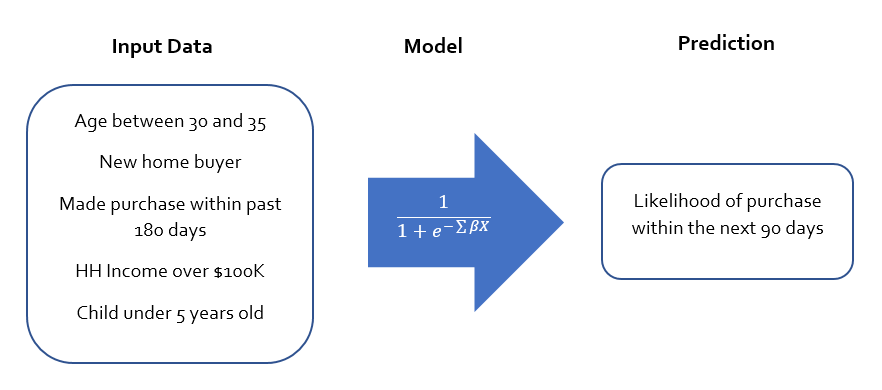
Propensity models are the type of predictive models that estimate how likely an individual is to take a certain action. The prediction may be formatted as a binary yes or no answer or a score, like a credit score.
Below is an example of using logistic regression for a predictive model that estimates propensity to make a purchase.
In many business settings, propensity modeling results are expressed in percentile-type groups, like quartiles, quintiles, or deciles. The top churn propensity decile is the top 10% of customers ranked by their likelihood to churn.
Forecasting
Time series analysis and forecasting are the staples of business analytics. With the abundance of data that we have today, the demand can be forecasted in much better detail, on a lower geographic or product level.
These analyses are usually done on an aggregate rather than an individual basis.
Recommendation Engines
Everyone who watched Netflix knows that they are very good at predicting the kind of movies and shows you would want to watch. This is based on the results of recommendation engines.
These engines predict how much you are going to like a certain product, or how likely you are to purchase a certain product so that the company suggests the best-fit products to you.
This type of modeling is on the blurred line between predictive and prescriptive analytics. Technically, the goal is to improve satisfaction, as opposed to selling more items or increasing watch time. It’s not unreasonable to expect the latter, nonetheless.
Common Applications of Predictive Models in Business
| Application | Model Type | Popular Modeling Techniques | Predicts |
| Purchase propensity model | Propensity Model | Logistic regression, Decision Tree, Random Forests, SVM | Likelihood to buy a product from the company in the next period of time |
| Churn propensity model | Propensity Model | Logistic regression, Decision Tree, Random Forests, SVM | Likelihood to become inactive in the next period of time |
| Predictive maintenance | Propensity Model | LSTM, Autoregression, Logistic regression, Decision Tree, Random Forests, SVM | Likelihood of a piece of equipment to fail in the next period of time |
| Customer demand forecasting | Forecasting Model | LSTM, autoregression, Linear (+Ridge/Lasso) regression, Random Forests | Demand in the next period of time |
| Purchase Recommendation | Recommendation Engine | Collaborative filtering | Customer rating or purchase likelihood for the product |
Distinction with a Difference
Why are propensity models not prescriptive? Aren’t you supposed to target customers with the highest propensity to buy or churn for purchase or churn prevention?
Not so fast.
When a company creates a propensity to purchase model, they usually don’t create a general “propensity to purchase a product” model, but a specific “propensity to purchase our product” model. That happens because the model is based on the purchases of the company’s own products, because this purchase data is readily available.
What the high score indicates is that a consumer is already likely to purchase your product, not that they need convincing. It is not clear from the model itself if the company’s marketing money is better spent targeting those who are already likely to buy the product or those who are not so sure.
The same is true – even more so – about the churn propensity models. If a customer has a high likelihood of a disconnect, should we spend money trying to dissuade them or are we more likely to convince customers with a lower propensity to stay longer?
To answer these questions, we need to think about the incremental impact of our actions on the behavior of consumers, and these questions are answered by prescriptive, not predictive analytics.
Examples of Prescriptive Analytics
Prescriptive analytics involves either a controlled or a natural experiment, and the analysis can be a report or a model.
A/B Tests and Controlled Experiments
These are the most simple prescriptive analytics options, and they are very similar to the clinical trials example I described above. As long as your groups are comparable, aka representative, you should be able to figure out whether your marketing campaign delivered enough sales over control to pay for itself, or whether option A or B is better.
Below is an example of how the test vs control method is used in marketing to determine the incremental impact of the program.
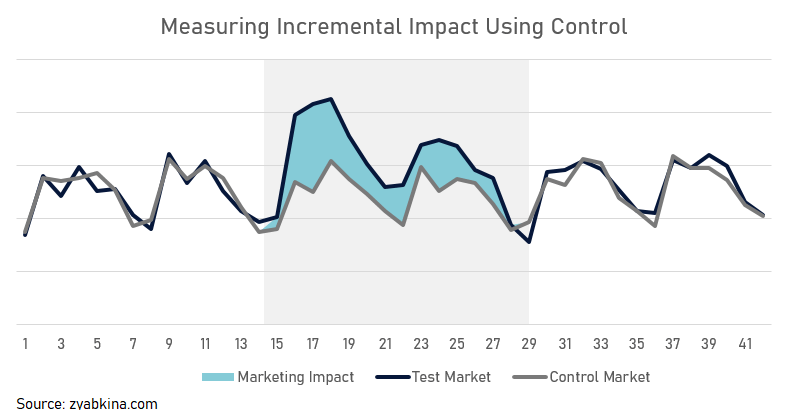
If you want to learn more about A/B tests and controlled experiments, I have written several articles, and this one is a good place to start.
The best thing about controlled experiments is how easy it is to figure out which segment did better in the marketing campaign and should be targeted in the future. All you need to do is to split your results into segments.
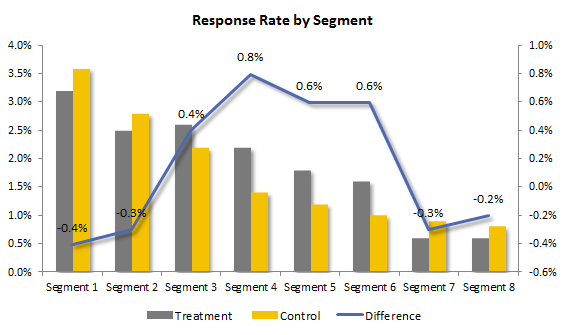
In the chart above, the difference signifies how well the campaign has done by segment.
Can you tell which segments responded to the campaign well, and which did not?
Uplift modeling
Uplift modeling is a type of prescriptive analytics that is usually run in conjunction with an experiment. It is similar to propensity modeling, but it adds the company’s actions to the mix, and its goal is to estimate which action delivered better results.
Uplift modeling can be hard to successfully execute, as the effects we are looking for are often weak. I wrote an article about the challenges of uplift modeling.
Marketing mix modeling
Marketing mix modeling is a type of prescriptive analytics that analyzes naturally occurring differences in the levels of marketing spend, and determines whether they drive sales and by how much.
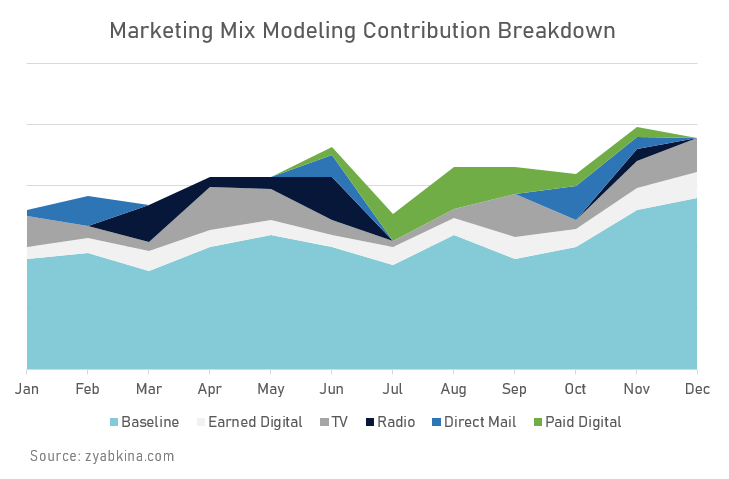
The inputs of the model are the levels of marketing spend in each geographic market in each period (usually a week or a month), and the output is the sales in those markets, often expressed as year over year change.
The baseline sales are the spontaneous sales that would happen if your company turned off all of its marketing. These sales are attributed to your brand equity. For well-known brands, it is not unusual to see as much as 90% of sales to be baseline sales.
Marketing mix modeling estimates how much different media contributed to the sales, and from the results, we can calculate marketing ROI. This is the information we need to rebalance and optimize our marketing spend.
Conclusion
In many areas of business, predictive analytics is different from prescriptive analytics because it does not directly evaluate the impact of the company’s actions on the outcome.
The concept of incrementality is central to understanding why prescriptive analytics is different. We are looking at the incremental effect of our actions on the behavior of customers, and these are not always correlated to their baseline actions, offered by predictive analytics.
Take this knowledge and use it to contribute to the bottom line of your company. For a specific marketing example, you can read my article that outlines three types of analytics and how to leverage them in a B2C business.