Churn prediction is the process of creating a predictive model that estimates the likelihood of a customer canceling their service in a future period of time. Churn prediction is used to understand churn drivers, evaluate retention programs, and calculate the customer lifetime value.
In this article, I will use my experience as a Director of Retention Analytics for a major US cable company to explain the benefits of a churn prediction model and when it is a good time to create one.
The Right Time for Churn Prediction
Your organization may benefit from a churn prediction model after you analyzed churn at a high level and determined that calculating a specific churn propensity score is feasible and in line with your business goals.
The feasibility of the modeling effort depends on whether you can collect enough data in an acceptable format and whether the data reveals relationships between input variables and churn rates.
Churn Prediction Data
In the subscription industry, the standard churn data analysis has two parts: 1) the snapshot of all subscribers before or at the beginning of the analysis period 2) a churn flag indicating whether a customer churned during the analysis period.
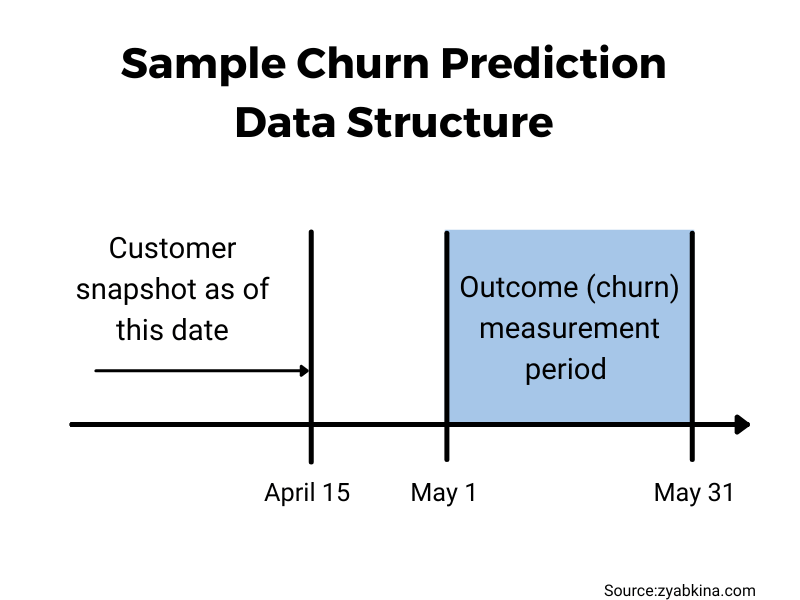
This setup is superior to cohort analysis, which groups subscribers based on when their relationship started. It delivers a basic understanding of churn, but its data structure is not suitable for predictive modeling because of the lack of churn drivers.
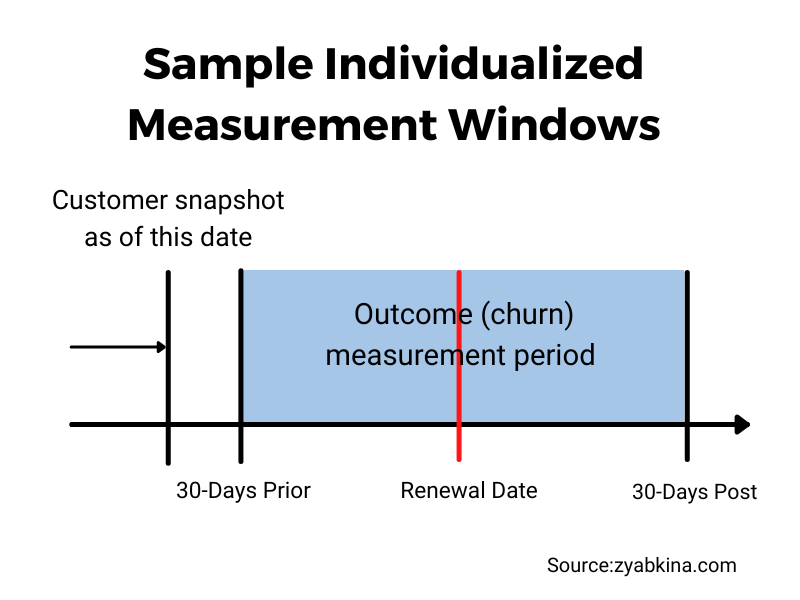
If your subscriptions are renewed annually, and you are interested in predicting who will and won’t renew their membership, it is best to line up your data by the renewal date. In this case, you can have a snapshot of the customer with their attributes right before the renewal period started, and your outcome whether there was a completed renewal at the end of the cancellation period.
In this case, every pre and post-period is individualized to a specific customer event date.
As a general rule, you don’t need a predictive model to tell which factors drive your churn. This insight can and should be drawn from the exploratory churn analysis. I wrote a detailed guide on how to analyze churn and its important considerations here.
In reality, many organizations skip the exploratory analysis and jump into creating a predictive model immediately. They collect the data specifically for modeling and pay little attention to exploratory analysis before jumping into prediction. Being not too precious about my craft, I am okay with this approach. There are many ways to learn about your churn, and modeling is one of them.
Best Uses of Churn Prediction Model
Based on my years of experience with retention and churn data, churn prediction models get their best mileage when used for retention program evaluation and calculation of customer lifetime value.
You probably wonder if churn prediction can be used to prevent and reduce churn. After all, this is what most articles tell you: find customers most likely to cancel and target them for retention.
Unfortunately, real life is not so simple.
Subscribers with a high propensity to churn are not always the best targets for retention. While this approach may work for some companies, churn reduction is a tough nut to crack, and in most organizations, high churners do not make good prevention targets.
For example, in the telecommunication business, the high churn propensity subscribers are often the ones late on their bill. The company is already keenly aware of these customers’ existence and has tried different ways to intervene.
Discovering that late payers are at a high risk of disconnect is trivial and fails to generate new ideas for churn reduction.
The way I approached this conundrum was to predict disconnects both in total and by the disconnect reason and then use the propensity scores to evaluate the effectiveness of retention programs.
Using Churn Prediction to Match Customer Groups
Voluntary churn is the most common target for churn reduction. But when customers are targeted for voluntary churn, the programs tend to be market-wide, and often only the customers who raise their hand (phone the call center, use a particular service) get exposed to the retention treatment.
It’s hard to figure out if these programs retain additional customers because of self-selection and marketwide exposure.
When analyzing whether a retention program made a difference I use churn propensity scores to make sure I compare program participants to a comparable baseline.
Creating a comparable baseline can be done in two main ways: 1) by recruiting your matched group using stratified sampling based on churn propensity scores and 2) by reweighting the results based on the propensity scores.
Here is an example of how I analyzed the incremental impact of a subscription price increase on subscriber churn.
The retail price increase in the cable business impacts customers who do not have a promotional rate for this service. That means that these customers have stayed with the company long enough that their promotional rate expired. Thus, the subscribers who get this particular price increase tend to be tenured subscribers, and this group churns at a much lower rate than the average.
In analytical terms, the groups that get and don’t get the treatment are not representative of each other. This makes it difficult to determine an appropriate churn baseline for the price increase group.
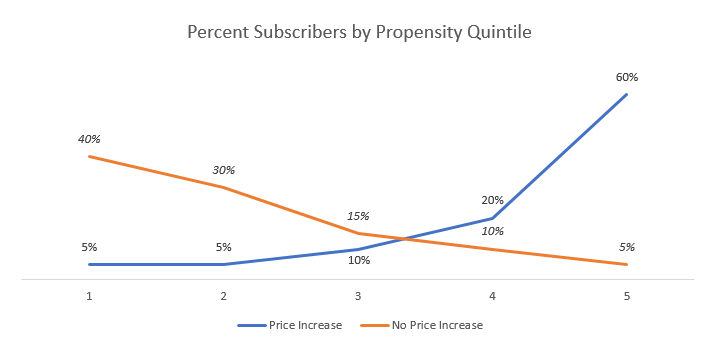
To make sure we are comparing apples to apples, I used the churn propensity score to split both groups into comparable churn buckets. In this example, the total churn rate of the price increase customers was lower than that of the non-rate increase customers, however, in each churn propensity quintile (one fifth, ranked by churn score), subscribers who got the price increase churned at a higher rate than those who did not.
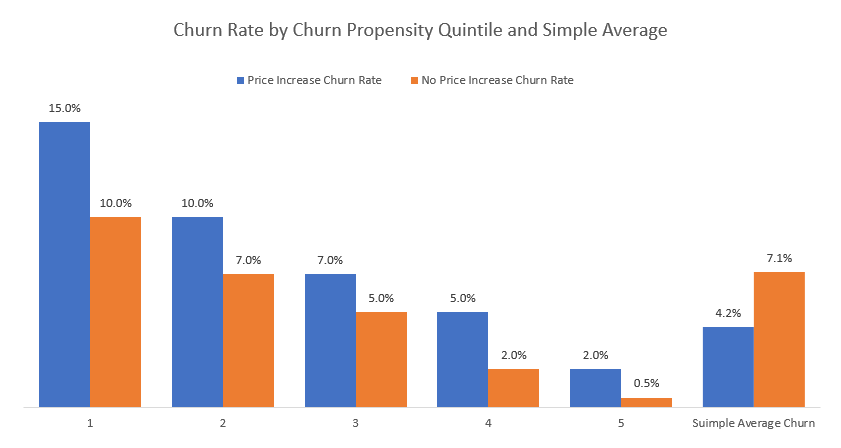
After that, the difference in churn rates was calculated by the propensity bucket, and the total churn rate difference is the weighted average of by-bucket differences.
| Customer Group | Price Increase | Price Increase | No Price Increase | No Price Increase | Incremental Churn | Weight |
| Churn Propensity Quintile | 90-day Churn Rate | Percent subscribers | 90-day Churn Rate | Percent subscribers | Churn Rate Difference | Percent |
| 1 | 15% | 5% | 10% | 40% | 5.0% | 5% |
| 2 | 10% | 5% | 7% | 30% | 3.0% | 5% |
| 3 | 7% | 10% | 5% | 15% | 2.0% | 10% |
| 4 | 5% | 20% | 2% | 10% | 3.0% | 20% |
| 5 | 2% | 60% | 0.5% | 5% | 1.5% | 60% |
| All Subscribers | 4.2% | 100% | 7.1% | 100% | 2.1% | 100% |
Therefore, we can create a comparable baseline of non-price-increase customers for our price increase group, reweigh their churn rate, and find the true incremental churn that occurred due to the price increase.
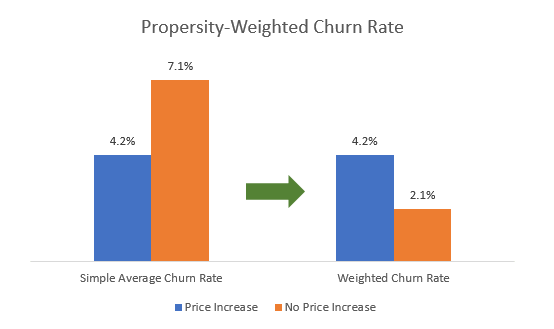
The weighted difference showed that 2.1% of the post price increase churn was driven by the higher prices, or that the price increase doubled the churn in the post period.
Using Churn Prediction to Calculate Lifetime Value
Determining the lifetime value (LTV) of individual customers is a great use of a churn prediction model.
Customer lifetime value is the sum of the profit the customer is expected to bring in during their active time with the company. A simple way to determine LTV is to calculate an average profit from past customers, however, this is a one fits all approach that misses individual differences. Churn prediction personalizes the calculation and assigns specific values to each subscriber.
I used these personalized lifetime values for a more precise calculation of marketing ROI and to understand the customers brought by different marketing campaigns.
Lifetime Value is the sum of the margin (profit) from a subscriber over their active period.
If the profit from an active customer per month is $1, we can look at how much they paid in the past and calculate the likelihood of them paying in the future. The margin chart looks like this:
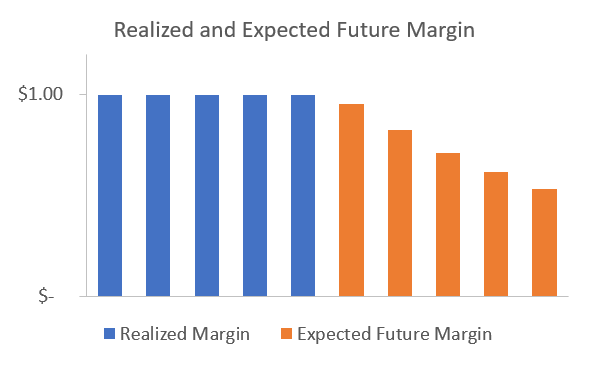
The LTV from this customer is the sum of realized margin and the expected future margin.
For a new subscriber, the lifetime value is the average margin per period times the expected number of active periods.
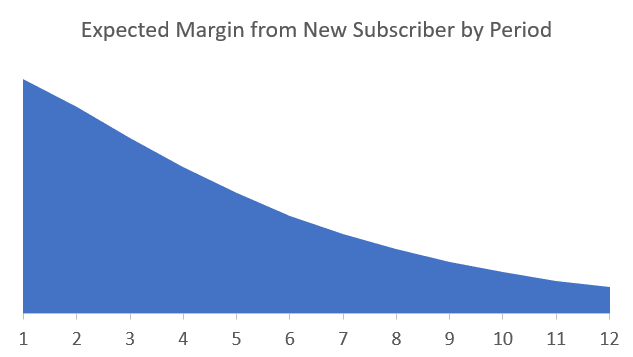
We can use churn prediction to estimate the expected number of active periods by using this formula:
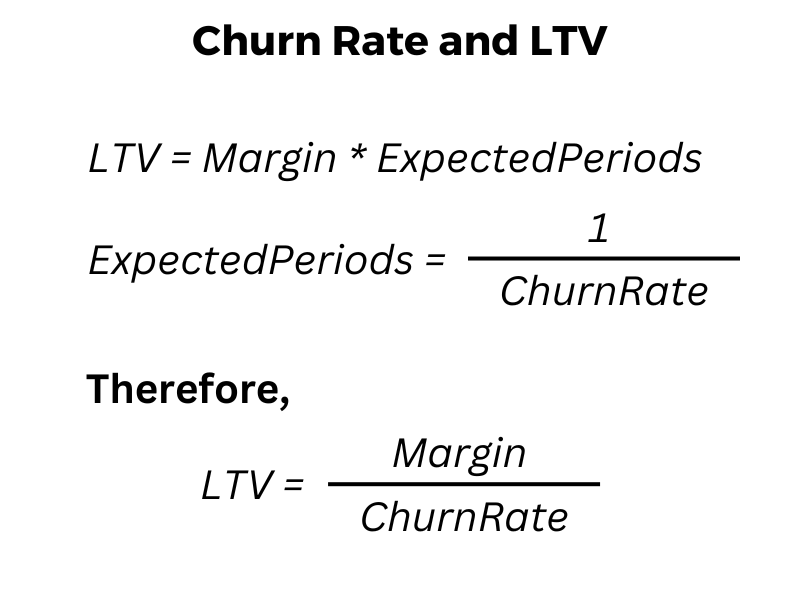
If we have the churn rate prediction for an individual prospect or subscriber, we can calculate individualized LTV or future margin for them, thus giving us information about how important this particular customer is to the business.
Let’s try a sample calculation.
A customer is paying us $100 a month, and our gross margin is 50%. Their predicted churn is 2.2% a month (for simplicity, let’s disregard seasonality). Based on these data, we can calculate their expected future lifetime value as ($100*50%)/2.2% = $2,272, or $50 gross profit for the residual 45.5 months.
Conclusion
You probably wonder if churn prediction can be used to prevent and reduce churn. Analytics can indeed be used for churn reduction, but its best application is not what most people think.
You should not bombard the most likely to churn customers unless you have good proof of it being the best strategy – compared to other strategies. You can learn how to use analytics to reduce and prevent churn through retention experiments from this article.