How to Define Customer Churn Rate

How to calculate churn rate

Churn rate over a period of time is the number of customers who went from being active to being inactive over that period divided by the number of active customers at the beginning of the period.

There are many intricacies of defining churn that can be applicable to certain industries.

Successfully Deploying Churn Prediction Models

Successfully deploying churn models in business

Churn prediction is the process of creating a predictive model that estimates the likelihood of a customer canceling their service in a future period of time. Churn prediction is used to understand churn drivers, evaluate retention programs, and calculate the customer lifetime value. In this article, I will use my experience as a Director of … Read more

How to Predict Churn

How to Predict Churn

This article summarizes my experience analyzing and predicting churn for a major US telecom provider. Since I worked in the telecom industry, subscriber service cancellations were called disconnects, and I will use churn, cancellations, and disconnects interchangeably. Churn prediction model estimates the likelihood of a customer canceling their service during a specific future period of … Read more

Predictive vs. Prescriptive Analytics

Predictive vs Prescriptive Analytics

The difference between predictive and prescriptive analytics is that predictive analytics makes a prediction under business as usual conditions, and prescriptive analytics is focused on measuring the incremental impact of your action. If predictive analytics assesses the baseline, prescriptive analytics estimate how much you can change that baseline.

Control (Holdout) Group Sample Size

Article: Control group size

So, you have decided to measure your marketing campaign against a control group.

Congratulations! You are on the right path.

Now you need to figure out how many targets you need, particularly, how many targets needed in a control group.

Churn Analysis in Excel: Step-by-Step Guide

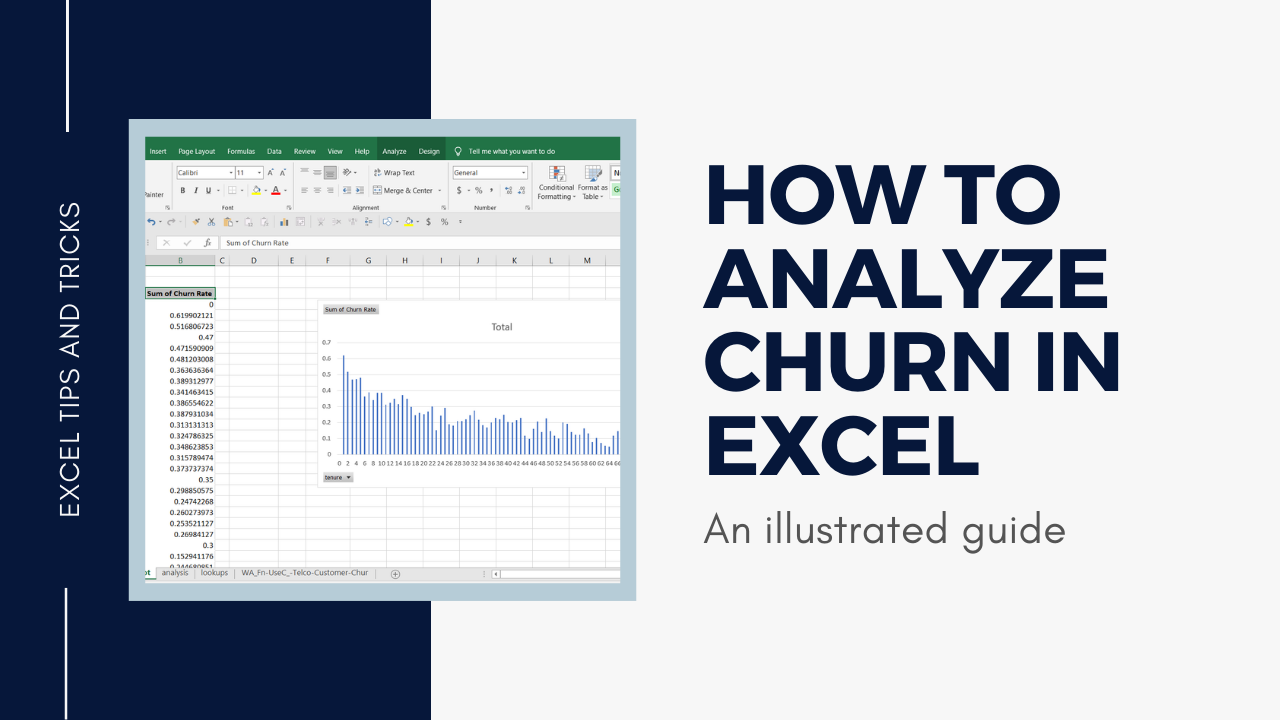
How to analyze churn in excel article

There are many data solutions that let you handle churn analysis, and Excel is definitely one of them. Pivot tables and charts are particularly nice ways to summarize, slice and dice, and visualize churn data. With a few helpful tips, you will be well on your way to a better attrition analysis.

AWS Comprehend: Illustrated How-to Guide

Background vector created by rawpixel.com - www.freepik.com

Amazon Comprehend is a Natural Language Processing (NLP) platform available as a service on AWS. It’s a collection of pre-trained and operational NLP models that can be used with no or little coding through the point and click interface. In addition to point and click interface, you can call the services through the API directly from the terminal or python.